Understanding Instead of Searching – Data That Tells Stories!
Data is powerful – but only if it's understandable. You look at the same numbers above, but they become tangible! With Power BI, you transform complex information into clear, concise visualizations that everyone understands – quickly and intuitively.
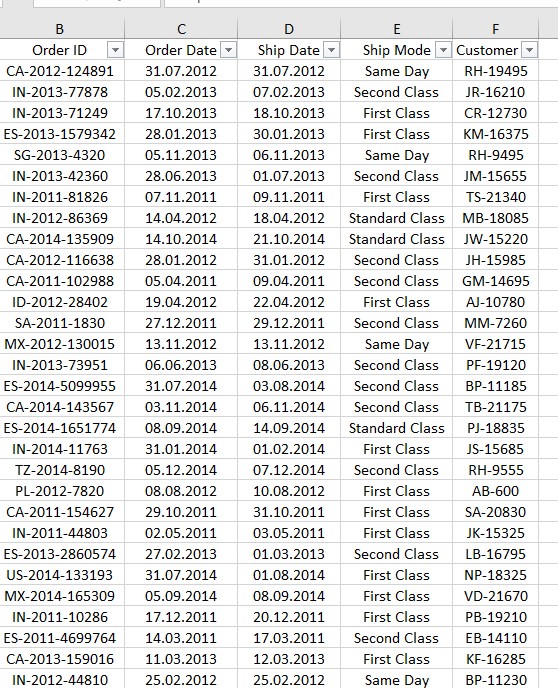
Excel Table
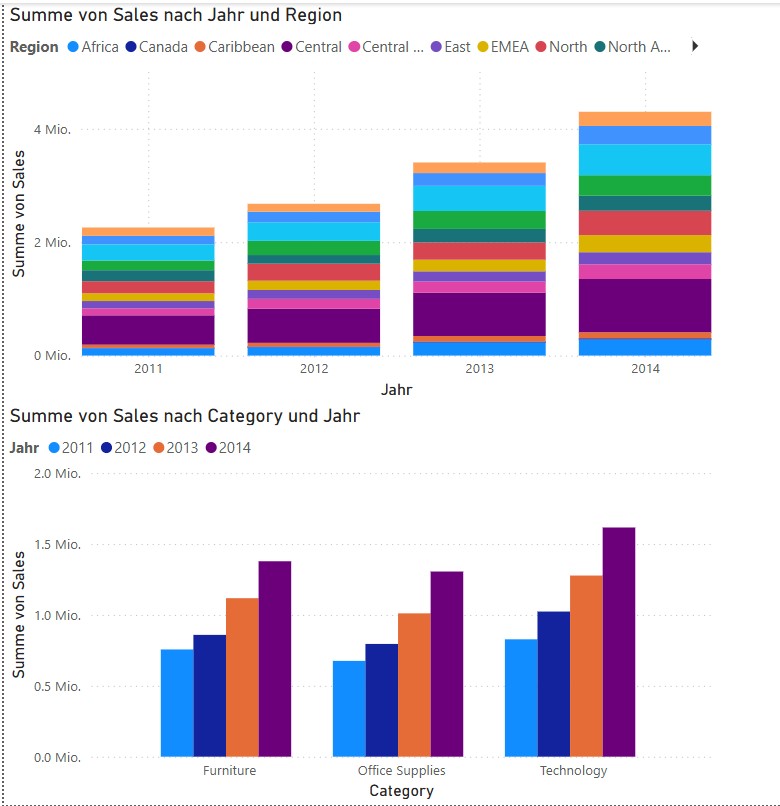
Power BI Visual
The trick? Your data becomes interactive! With a few clicks, you recognize outliers, patterns, and trends that were previously invisible. And the best part: The time you used to waste creating reports can now be invested in what really matters – smart decisions and new opportunities.
Interactive Data Analysis
Power BI not only gives your data a voice but makes it your best advisor. Because great decisions need great visualizations!
Say goodbye to data salad – and hello to clear insights!